
What useful tips and tricks can I use to quickly gain insight into my data in Excel?
Introduction
Excel is a powerful tool used by many professionals to organize, analyze, and present data. Whether you are a beginner or an experienced user, understanding your data in Excel in Office can sometimes be challenging. Fortunately, there are handy tips and tricks you can use to quickly gain insight into your data and work more efficiënter.
In this blog post we will discuss a number of these tips and tricks that can help you get the most out of Excel and increase your productivity. Whether you are working with simple lists or complex datasets, these tips will help you quickly find important information, avoid errors, and create professional-looking reports.
By applying these tips, you will notice that you spend less time searching for information and have more time left to actually work on interpreting your data and making well‑informed decisions based on it.
Key takeaways:
- Use of filters: Use filters to find and analyze specific data within a large dataset.
- Charts and diagrams: Use charts and diagrams to display data visually and quickly identify trends and patterns.
- Use of formulas and functions: Make optimal use of formulas and functions in Excel to perform calculations and analyses and gain insight into complex data.
Preparing and Organizing Data
Data cleaning
Cleaning data is a essentiële step to ensure that your analyses are accurate. This includes removing duplicate values, correcting spelling errors, and handling empty cells. By having consistent and correct data, you avoid errors in your analyses and save time when interpreting the results.
Consistent Data Layout
A consistent data format is crucial for easily analyzing data in Excel. This means that date fields have the same notation, numbers are uniformly formatted, and text fields are filled in a consistent manner. By ensuring a consistent data format, you avoid confusion and inaccuracies when performing analyses.
Optimally Using Formulas and Functions
Basic Formulas for Data Analysis
To quickly gain insight into your data in Excel, it is essential to master basic formulas for data analysis. With formulas such as SUM, AVERAGE, MIN, MAX and COUNT, you can easily calculate important statistics and discover trends in your data. By applying these formulas correctly, you can quickly extract essentialële information from your data and make better decisions.
Advanced Features for In-Depth Insight
For deep insight into your data you can use advanced functions that Excel offers. Functions such as INDEX, MATCH, INDIRECT and COUNTIF can help you perform complex analyses and identify specific patterns in your data. By applying these advanced functions correctly, you can discover hidden insights that you may have previously overlooked. Using advanced functions enables you to delve deeper into your data in an efficiënte manner and draw valuable conclusions.
Visualization tools and charts for data insight
Selecting and Adjusting Charts
When you want to visualize data in Excel, charts are a powerful tool to quickly gain insight. By selecting and customizing the right chart, you can present complex data in a simple and clear way. It is important to choose the right chart type that fits the nature of your data, such as line charts for trends, bar charts for comparisons and pie charts for distributions. Also make sure to adapt the chart to your specific needs by adding labels, adjusting colors and naming axes.
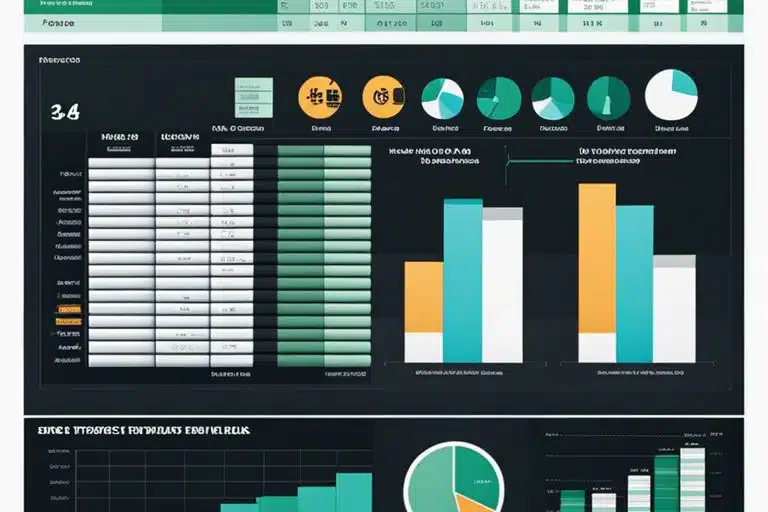
Creating Dynamic Dashboards with Slicers and PivotTables
With dynamic dashboards allow you to gain insight into your data in Excel in an interactive way. By using slicers within PivotTables, you can easily filter and visualize data based on specific criteria. PivotTables enable you to quickly create summary analyses and with slicers you can adjust these analyses dynamically. This enables you to quickly identify trends and patterns and dive deeper into your data without having to use complex formulas.
Keyboard shortcuts and productivity tips
If you want to work efficiently in Excel, it is important to use shortcuts and productivity tips. With these handy tricks you can save time and get your work done faster. Here are some shortcuts and tips that can help you quickly gain insight into your data.
Keyboard shortcuts for Fast Data Analysis
By using shortcuts you can easily navigate large amounts of data and analyze it. Ctrl + arrow keys can, for example, be used to quickly jump to the beginning or end of a dataset. With shortcuts like Ctrl + Shift + arrow keys you can quickly select and edit multiple cells. This is useful when filtering data or performing calculations.
Macro’s and Automation Techniques
A powerful way to speed up your work in Excel is by using macros and automation techniques. With macros you can automate repetitive tasks, saving you a lot of time. Additionally, you can automation techniques perform complex calculations and analyses with just a click of a button. However, it is important to be careful when using macros, as they can be potentially dangerous if applied incorrectly.
Besides the fact that macro’s and automation techniques can increase your productivity, they also provide the ability to reduce errors and achieve consistent results. Make sure you are familiar with the basics of macro’s before using them, and always back up your data before automating important actions. Besides the potentially dangerous side, can macro’s and automation techniques can be a valuable addition to your Excel skills.
Strengthening Data Analysis with Add-ins and External Tools
Excel Add-ins for Data Analysis
Excel add-ins are powerful tools that add functionality to Excel to improve data analysis. With add-ins such as Power Query, Power Pivot, and Solver, you can manipulate, analyze, and solve problems with data efficiently. These tools provide advanced capabilities for processing and visualizing data, allowing you to quickly gain insight and make decisions based on reliable analyses.
Integration of External Tools and Services
By integrating external tools and services into Excel, you can add even more value to your data analysis. Consider linking Excel to business intelligence tools such as Tableau, Google Data Studio, or using cloud services such as Power BI. These integrations provide the ability to perform complex analyses and discover patterns that are difficult to achieve with standard Excel functionalities. By using external tools and services, you elevate your data analysis to a higher level and can obtain valuable insights in an efficiënte manner for your business or project.
Conclusion
In this article we have discussed various handy tips and tricks to quickly gain insight into your data in Excel. With the help of these tips you can work more efficiënter and find the information you need faster. It is important to know these functions to get the most out of Excel.
It is essential to structure and format your data well, so that you can easily analyze and present important information. Using filters, sorting, and conditional formatting can help you quickly evaluate data and discover trends.
However, be careful of errors when working with formulas and functions in Excel. A small mistake can have major consequences for the accuracy of your data. Always check your formulas and validate your results to avoid inaccuracies.
Additionally, it is advisable to regularly save your work and make backups of your files. Nothing is as frustrating as losing all your hard work due to a computer crash or human error. Make sure your data is safe and that you always have access to a recent version of your file.
With these tips and tricks you can effectively make use of Excel and harness the maximum potential of this powerful tool. Keep practicing and experimenting with various functions to improve your skills and optimize your work.
Don't forget that Excel can be a valuable ally in your daily tasks and projects, provided you have the right knowledge and skills to work with it effectively. Keep learning and growing, and you will notice that you become increasingly proficient at analyzing and presenting data in Excel.
FAQ
V: What are some handy tips to quickly gain insight into my data in Excel?
A: A number of handy tips and tricks to quickly gain insight into your data in Excel are the use of filters, pivot tables, charts, conditional formatting, and creating summaries with subtotals.
V: How can I use filters to analyze my data in Excel?
A: By using filters, you can easily filter data on specific criteria, giving you quick insight into only the relevant data. You can apply filters to columns to sort data, filter on values or conditions, and even create custom filters.
V: What is a pivot table and how can it help in analyzing data in Excel?
A: A pivot table is a powerful tool that allows you to summarize, analyze, and visualize data. You can easily summarize large amounts of data and discover trends, patterns, and relationships by simply dragging and dropping fields to get different views of the data.
Q: How can I use charts to visualize my data in Excel?
A: Charts are an excellent way to display data visually and make it insightful. You can create various types of charts, such as bar charts, line charts, pie charts, and more, to discover trends, comparisons, and patterns in your data.
Q: How can conditional formatting help quickly identify certain data in Excel?
A: Conditional formatting allows you to apply formatting rules to cells based on specific conditions. This enables you to quickly highlight, accentuate, or make certain data stand out, giving you easy insight into the data that meets certain criteria.